
Synesthetic Spectrum
Synesthetic Spectrum is an interactive brainwave-visualization project that transforms internal mental states, such as focus, relaxation, or emotional fluctuation, into real-time visual form. This project uses the Muse 2 EEG headset and TouchDesigner to create a soft, evolving visual landscape that reacts directly to a user's neural activity, inviting reflection, presence, and emotional awareness.
Context
Problem Focus
Eunoia & Eunoia II by Lisa Park
In a world where wearable tech and biometric tracking are becoming commonplace, much of the focus remains on performance, productivity, or diagnosis. This project positions itself differently: it asks how physiological data, specifically brainwave patterns, might support self-reflection and empathic interaction. Rather than quantifying the self, it seeks to make the self visible, felt, and experienced.
In daily life, our feelings and thoughts—like focus, stress, or tiredness—are often hard to notice and describe. While technology is being used to improve performance, few tools help people connect with their emotions. This project addresses three main issues:
Invisibility of Inner States — Our feelings are rarely shown in real time, making it difficult to understand or discuss them.
Focus on Control in Biofeedback Tools — Most brain wave apps try to judge or fix how a person feels. This project avoids that by creating a neutral space for expression.
Lack of Sensory Awareness — There are few systems that let users experience their feelings in a gentle, visual, and non-verbal way.
Research & Precedents

One of the major inspirations behind Synesthetic Spectrum is Lisa Park’s Eunoia series, where she uses EEG headsets to translate emotional states into physical vibrations on water surfaces. Her work explores how invisible emotions—such as love, anger, or sadness—can be externalized into tactile, poetic forms.
What resonated deeply with me was not just the translation of brain data into visuals, but the emotional vulnerability embedded in the experience. Park’s work challenged the notion of data as clinical or cold; instead, it became intimate, expressive, and bodily. This inspired me to design a system where internal states are not monitored for optimization, but revealed for reflection—gently, honestly, and in real time.
Here are the links to her projects:
https://www.thelisapark.com/work/eunoia ,https://www.thelisapark.com/work/eunoia2
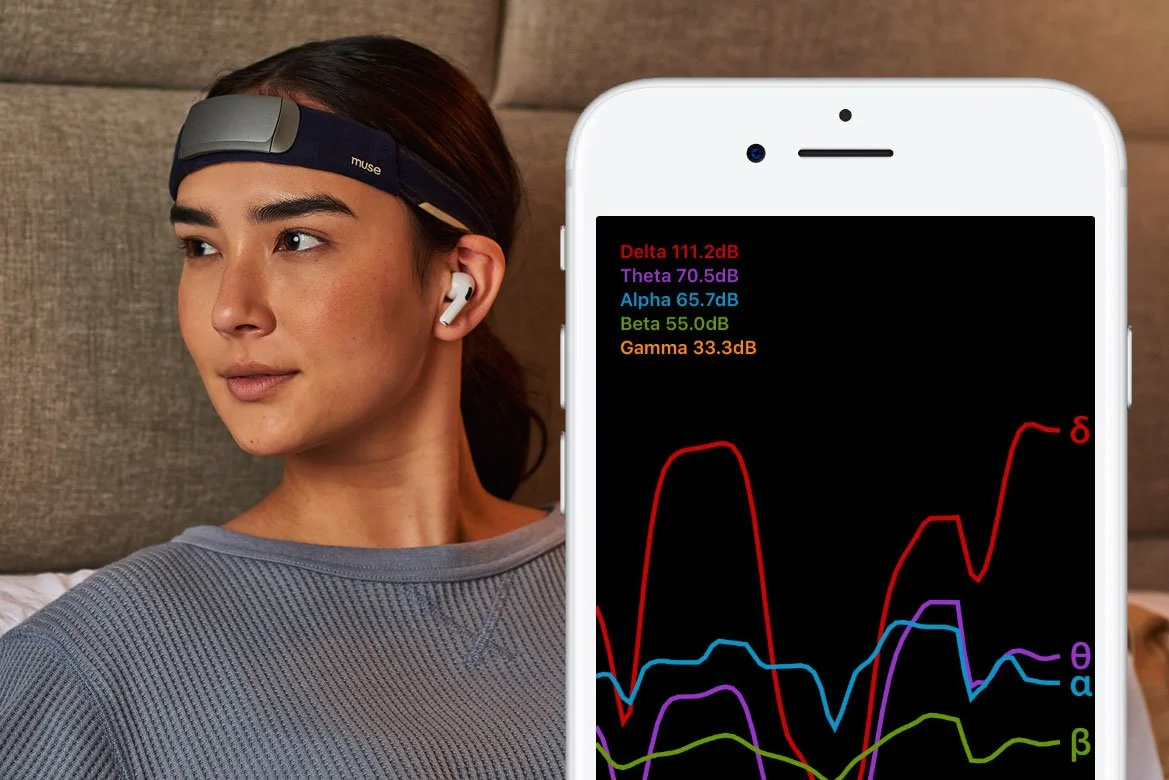
Muse is a commercially available EEG headband designed to support mindfulness and focus. The app provides users with real-time auditory feedback—such as weather sounds—to indicate levels of mental activity or stillness, often rewarding focused attention with calming cues.
While Muse emphasizes self-optimization and behavioral feedback, Synesthetic Spectrum draws inspiration from its technical structure but reorients the experience toward emotional reflection rather than performance. Instead of judging mental states as good or bad, this project visualizes them as they are—fluid, shifting, and worth observing in their own right.
The link to the intro of the application:
https://choosemuse.com/pages/app?srsltid=AfmBOooW30mUTZ2-WznQ-W6KrhnJM2fU1JwXKli6iz8WUQd1LuZSqNO_
Affective Computing, a research domain pioneered at MIT Media Lab, investigates how machines can recognize, interpret, and respond to human emotions. The goal is to create emotionally intelligent systems that can adapt to users’ internal states, enhancing human-computer interaction through empathy and responsiveness.
Synesthetic Spectrum draws from this theoretical foundation, but reimagines its application through an artistic lens. Instead of designing systems that act on emotional data, this project creates a space where emotional and cognitive states are revealed and visualized, without intervention. It transforms affective data into an aesthetic and reflective experience, highlighting emotion as presence, not as a signal to optimize, but as something to observe, witness, and share.
The link to the research:
https://www-prod.media.mit.edu/videos/ac-2023-10-18-group-overview/?autoplay=true
Perceptual Translation: Making invisible internal states (focus, calm, tension) visible
Real-Time Reflection: Using Muse 2 and TouchDesigner to show moment-to-moment neural activity
Empathic Interface: Designing not for control, but for emotional mirroring
Experiential Portraiture: Letting the user witness a live portrait of their inner state
Methodology & Technical Flow


1. Muse 2 EEG headset captures real-time brainwaves
2. Python receives and parses Alpha, Beta, Theta, and Delta bands
Connecting Your EEG Device to Your Computer:
Download the Muse app on your computer.
Turn on your Muse 2 and connect it to the app.
Open the Terminal and type
muselsl streamto start streaming EEG data to TouchDesigner.You should see "Connected. Streaming EEG."
Send Data to TouchDesigner:
Install Python dependencies by running:
pip install python-osc numpyCreate a Python script by typing:
nano muse_to_td.pyCopy and paste the following code into the script:
from muselsl import stream, list_muses
from pylsl import StreamInlet, resolve_byprop
from pythonosc.udp_client import SimpleUDPClient
import numpy as np

# Set TouchDesigner IP and Port
TD_IP = "127.0.0.1"
TD_PORT = 9000
client = SimpleUDPClient(TD_IP, TD_PORT)

# Connect to Muse EEG Stream
print("Searching for EEG stream...")
streams = resolve_byprop('type', 'EEG', timeout=10)
if not streams:
    print("No EEG stream found. Ensure 'muselsl stream' is running.")
    exit()

inlet = StreamInlet(streams[0])
print("Connected to Muse EEG stream.")

while True:
    sample, timestamp = inlet.pull_sample()
    if sample:
        alpha = np.mean(sample) * 0.8
        beta = np.mean(sample) * 1.2
        theta = np.mean(sample) * 0.5
        delta = np.mean(sample) * 0.3

        # Send data to TouchDesigner
        client.send_message("/eeg/alpha", alpha)
        client.send_message("/eeg/beta", beta)
        client.send_message("/eeg/theta", theta)
        client.send_message("/eeg/delta", delta)

        print(f"Alpha: {alpha:.2f}, Beta: {beta:.2f}, Theta: {theta:.2f}, Delta: {delta:.2f}")
Open a new window and type
python3 muse_to_td.py. If it works, you will see the EEG data output.
3.OSC protocol sends values to TouchDesigner
Open TouchDesigner.
Create an OSC In CHOP (press Tab and search for OSC In CHOP).
Set these parameters:
Network Address: 127.0.0.1
Port: 9000
Active: Enable it.
Click the Monitor button to check if values for /eeg/alpha, /eeg/beta, /eeg/theta, and /eeg/delta are showing.
If the values update, TouchDesigner is receiving the EEG data.
Because the EEG data may not be very stable, to get a stable value, I used “select” to extract each wave and then connected the “math” separately to get a certain segment of the value, and then to achieve the visual effect I wanted.
4. TouchDesigner visual mapping guide
Alpha (8–12 Hz) – Linked to calmness and focus. Higher values create smooth, wave-like visuals, promoting stillness.
Beta (12–30 Hz) – Connected to alertness and concentration. Higher values make visuals sharper and more intense.
Theta (4–8 Hz) – Associated with meditation and introspection. Higher values cause visuals to soften and stretch.
Delta (0–4 Hz) – Represents deep rest. Lower values shift colors from bright to pale, indicating mental calmness.
I created a visual guide to help viewers understand how their mind influences what they see.
Frustration & Tips
Some Prototypes
A shifting, cloud-like form with color gradients and rhythmic expansion—directly shaped by the user’s brainwaves.
The final visual form in Synesthetic Spectrum was intentionally designed to feel soft, fluid, and emotionally resonant. Unlike the sharp, data-heavy aesthetics of traditional EEG visualizations, this work adopts a minimalist, atmospheric approach—shifting clouds, rhythmic pulsations, and a subtle sense of breath. The goal was to create a space where the viewer feels invited to observe, not overwhelmed by complexity.
Color was chosen as a key emotional translator. The gradient—from vibrant hues to pale yellow-white—reflects a conceptual arc from mental activity to mental stillness. Lower delta wave values yield saturated, vivid colors—representing high arousal or heightened engagement. As delta values increase, the colors fade into warmer, desaturated tones, signaling rest, presence, or mental quiet.
The project began with attempts to use a NeuroSky headset, but after failed connections, switching to Muse 2 ensured reliable data.
Device Technology Differences
NeuroSky MindWave, an early EEG device, has one dry electrode and lower data quality. Muse 2 features four electrodes and uses BLE for better data quality.
Developer Support & Software
Muse 2 offers superior API support, an official SDK, and a helpful community. NeuroSky's outdated SDK lacks documentation and compatibility with modern OS like macOS.
Connectivity Differences
NeuroSky connects via Bluetooth 2.0 or USB, risking driver issues, while Muse 2 uses BLE, allowing easier connection through the command line or Python on macOS/Linux.
Initially inspired by YouTube tutorials, a visually complex prototype was built. However, it overshadowed the data. A shift to simplicity brought the visuals closer to the mind they reflect.
Here is the link to the fancy YouTube tutorial if you would like to try:
https://www.youtube.com/watch?v=yCDIOIFbWm0
This project taught me that visual strength doesn’t always come from complexity—it comes from clarity of intention.
By embracing simplicity, I let the data speak for itself—and allowed the user’s inner world to take center stage.
After deciding to simplify the visual output, the visual began with a vibrant, structural prototype, where color-coded spheres dispersed from the edges of a 3D cube.
However, this prototype emphasized structure over sensation—it visualized data, but didn’t yet feel alive (not very organic and stable).
In the final version, the form evolved into a more organic, cloud-like entity (as I showed before). Colors now blend and pulse from a central mass, radiating soft waves in sync with brain activity. This shift embodies the emotional intent of the project: not just to map data, but to reflect inner states in a way that is soft, ambient, and immersive.
Now, let’s take a moment to discuss in detail what steps I took to achieve my final visual output. The first significant point to highlight is, as I previously mentioned in the methodology section, the importance of identifying and “select” a specific range and applying “math” to stabilize the EEG data, which ultimately leads to creating a more consistent and stable visual representation. The left picture illustrates that I incorporated the EEG data into various parameters such as noise’s “harmonic spread,” “exponent,” and “amplitude.” These adjustments allowed me the flexibility to experiment and fine-tune the visuals to my liking, and you can also play around with these settings to see the effects for yourself.
I used the delta wave (0–1) to visualize emotional depth through color as an input to a Switch TOP in TouchDesigner. This node dynamically blends between different gradient-based inputs (created via Ramp and Remap), allowing color to shift according to the user’s mental state.
The delta value is remapped and fed into the Index parameter of the Switch, selecting different visual styles.
The color I picked using ramp.
I added edge and feedback for the visuals. The Edge highlights the outlines of the particle cloud or noise field, creating a detailed mesh. This enhances clarity and structure, helping viewers see layers of form and movement. It's particularly effective for boosting contrast during moments of focus or daydreaming. The Feedback brings in a sense of memory. Instead of deleting each frame, it overlaps new visuals with previous ones, creating a fading trail. This results in a ghostly aura that remains as the user's mental state changes.


Future Direction


Incorporate sound for synesthetic audio-visual feedback
Enable multi-user interaction—collective neural landscapes
Integrate into urban space or therapeutic contexts
Explore color-emotion co-mapping using affective theory
Muse Meditation App
MIT Media Lab – Affective Computing
Concept & Goals


Final Visual Output
Final Visual Description
Visual Language & Color Rationale
Development Process


Rethinking Complexity
Prototyping Process
